 7 Days GolfingTour
 8 Days Group Tour
 8 Days Yunnan Tour
 7 Days Shangri La Hiking
 11 Days Yunnan Tour
 6 Days Yuanyang Terraces
 11 Days Yunnan Tour
 8 Days South Yunnan
 7 Days Tea Tour
 8 Days Muslim Tour
 12 Days Self-Driving
 4 Days Haba Climbing
 Tiger Leaping Gorge
 Stone Forest
 Yunnan-Tibet
 Hani Rice Terraces
 Kunming
 Lijiang
 Shangri-la
 Dali
Dali
 XishuangBanna
 Honghe
 Kunming
 Lijiang
 Shangri-la
 Yuanyang Rice Terraces
 Nujiang
 XishuangBanna
 Spring City Golf
 Snow Mountain Golf
 Stone Mountain Golf


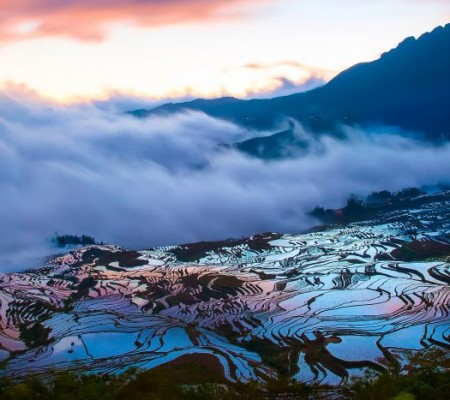
Changning County Climate
Changning climate is warm and temperate. There is more rainfall in the winter than that in the summer. It enjoys the subtropical monsoon climate, with four climate zones of low heat, warm heat, cool-warm and high cold. The average temperature in Changning is 16.7 °C. Precipitation here averages 1029 mm.
CLIMOGRAPH // WEATHER BY MONTH CHANGNING
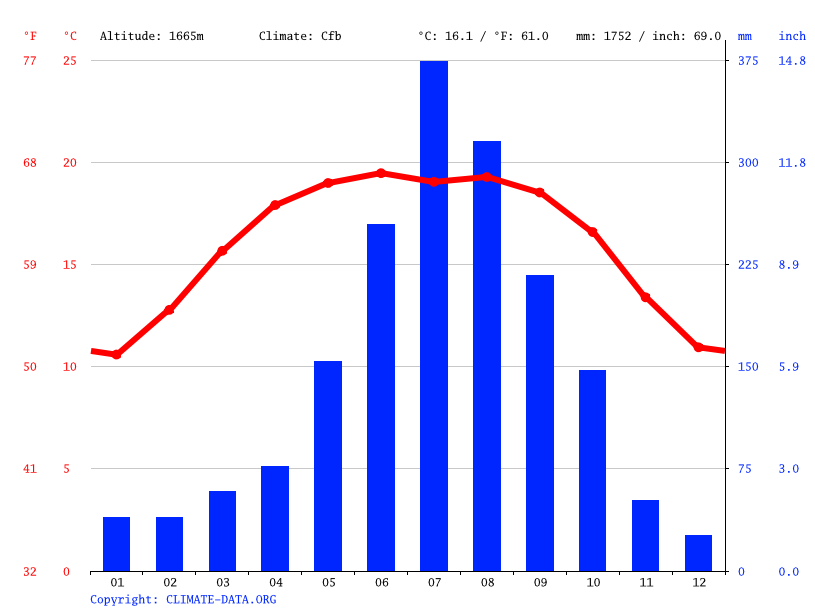
The driest month is January, with 16 mm of rain. With an average of 196 mm, the most precipitation falls in August.
TEMPERATURE GRAPH
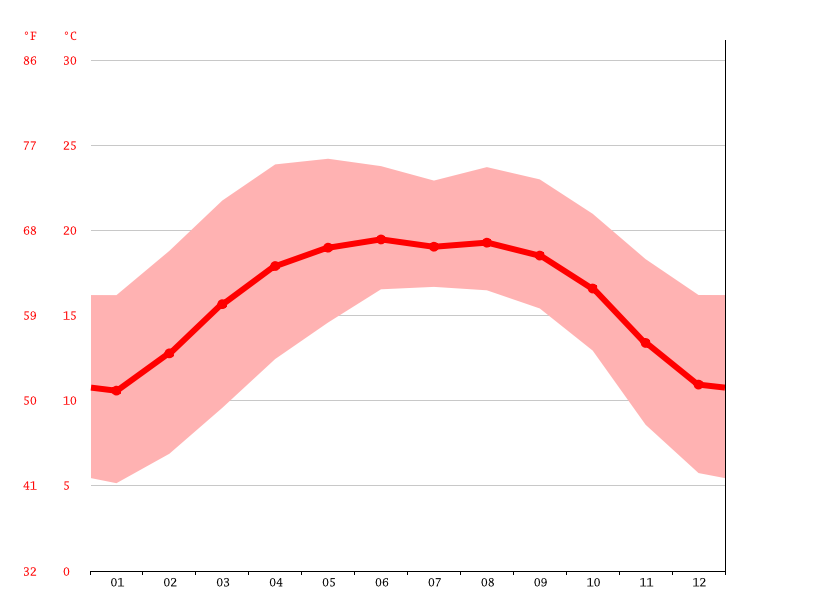 June is the warmest month of the year. The temperature in June averages 21.6 °C. January has the lowest average temperature of the year. It is 9.9 °C.
CLIMATE TABLE
Jan Feb Mar Apr May Jun Jul Aug Sep Oct Nov Dec
| Avg. Temperature (°C) | 9.9 | 11.4 | 14.3 | 17.2 | 20.1 | 21.6 | 21.5 | 21.4 | 20.4 | 18 | 13.9 | 10.6 |
| Min. Temperature (°C) | 2.5 | 4.1 | 6.8 | 10.3 | 14.4 | 17.8 | 18.1 | 17.5 | 16 | 13.2 | 7.8 | 3.7 |
| Max. Temperature (°C) | 17.3 | 18.8 | 21.9 | 24.2 | 25.9 | 25.4 | 24.9 | 25.4 | 24.9 | 22.9 | 20 | 17.6 |
| Avg. Temperature (°F) | 49.8 | 52.5 | 57.7 | 63.0 | 68.2 | 70.9 | 70.7 | 70.5 | 68.7 | 64.4 | 57.0 | 51.1 |
| Min. Temperature (°F) | 36.5 | 39.4 | 44.2 | 50.5 | 57.9 | 64.0 | 64.6 | 63.5 | 60.8 | 55.8 | 46.0 | 38.7 |
| Max. Temperature (°F) | 63.1 | 65.8 | 71.4 | 75.6 | 78.6 | 77.7 | 76.8 | 77.7 | 76.8 | 73.2 | 68.0 | 63.7 |
| Precipitation / Rainfall (mm) | 16 | 24 | 30 | 34 | 73 | 161 | 188 | 196 | 133 | 119 | 39 | 16 |
There is a difference of 180 mm of precipitation between the driest and wettest months. During the year, the average temperatures vary by 11.7 °C.
Best Time to Visit
Without severe cold in winter and burning hot in summer, Changning county has a warm and comfortable climate all year round. So four seasons are good for traveling.


